Seaborn Plot-3.1028.1003
Required Input
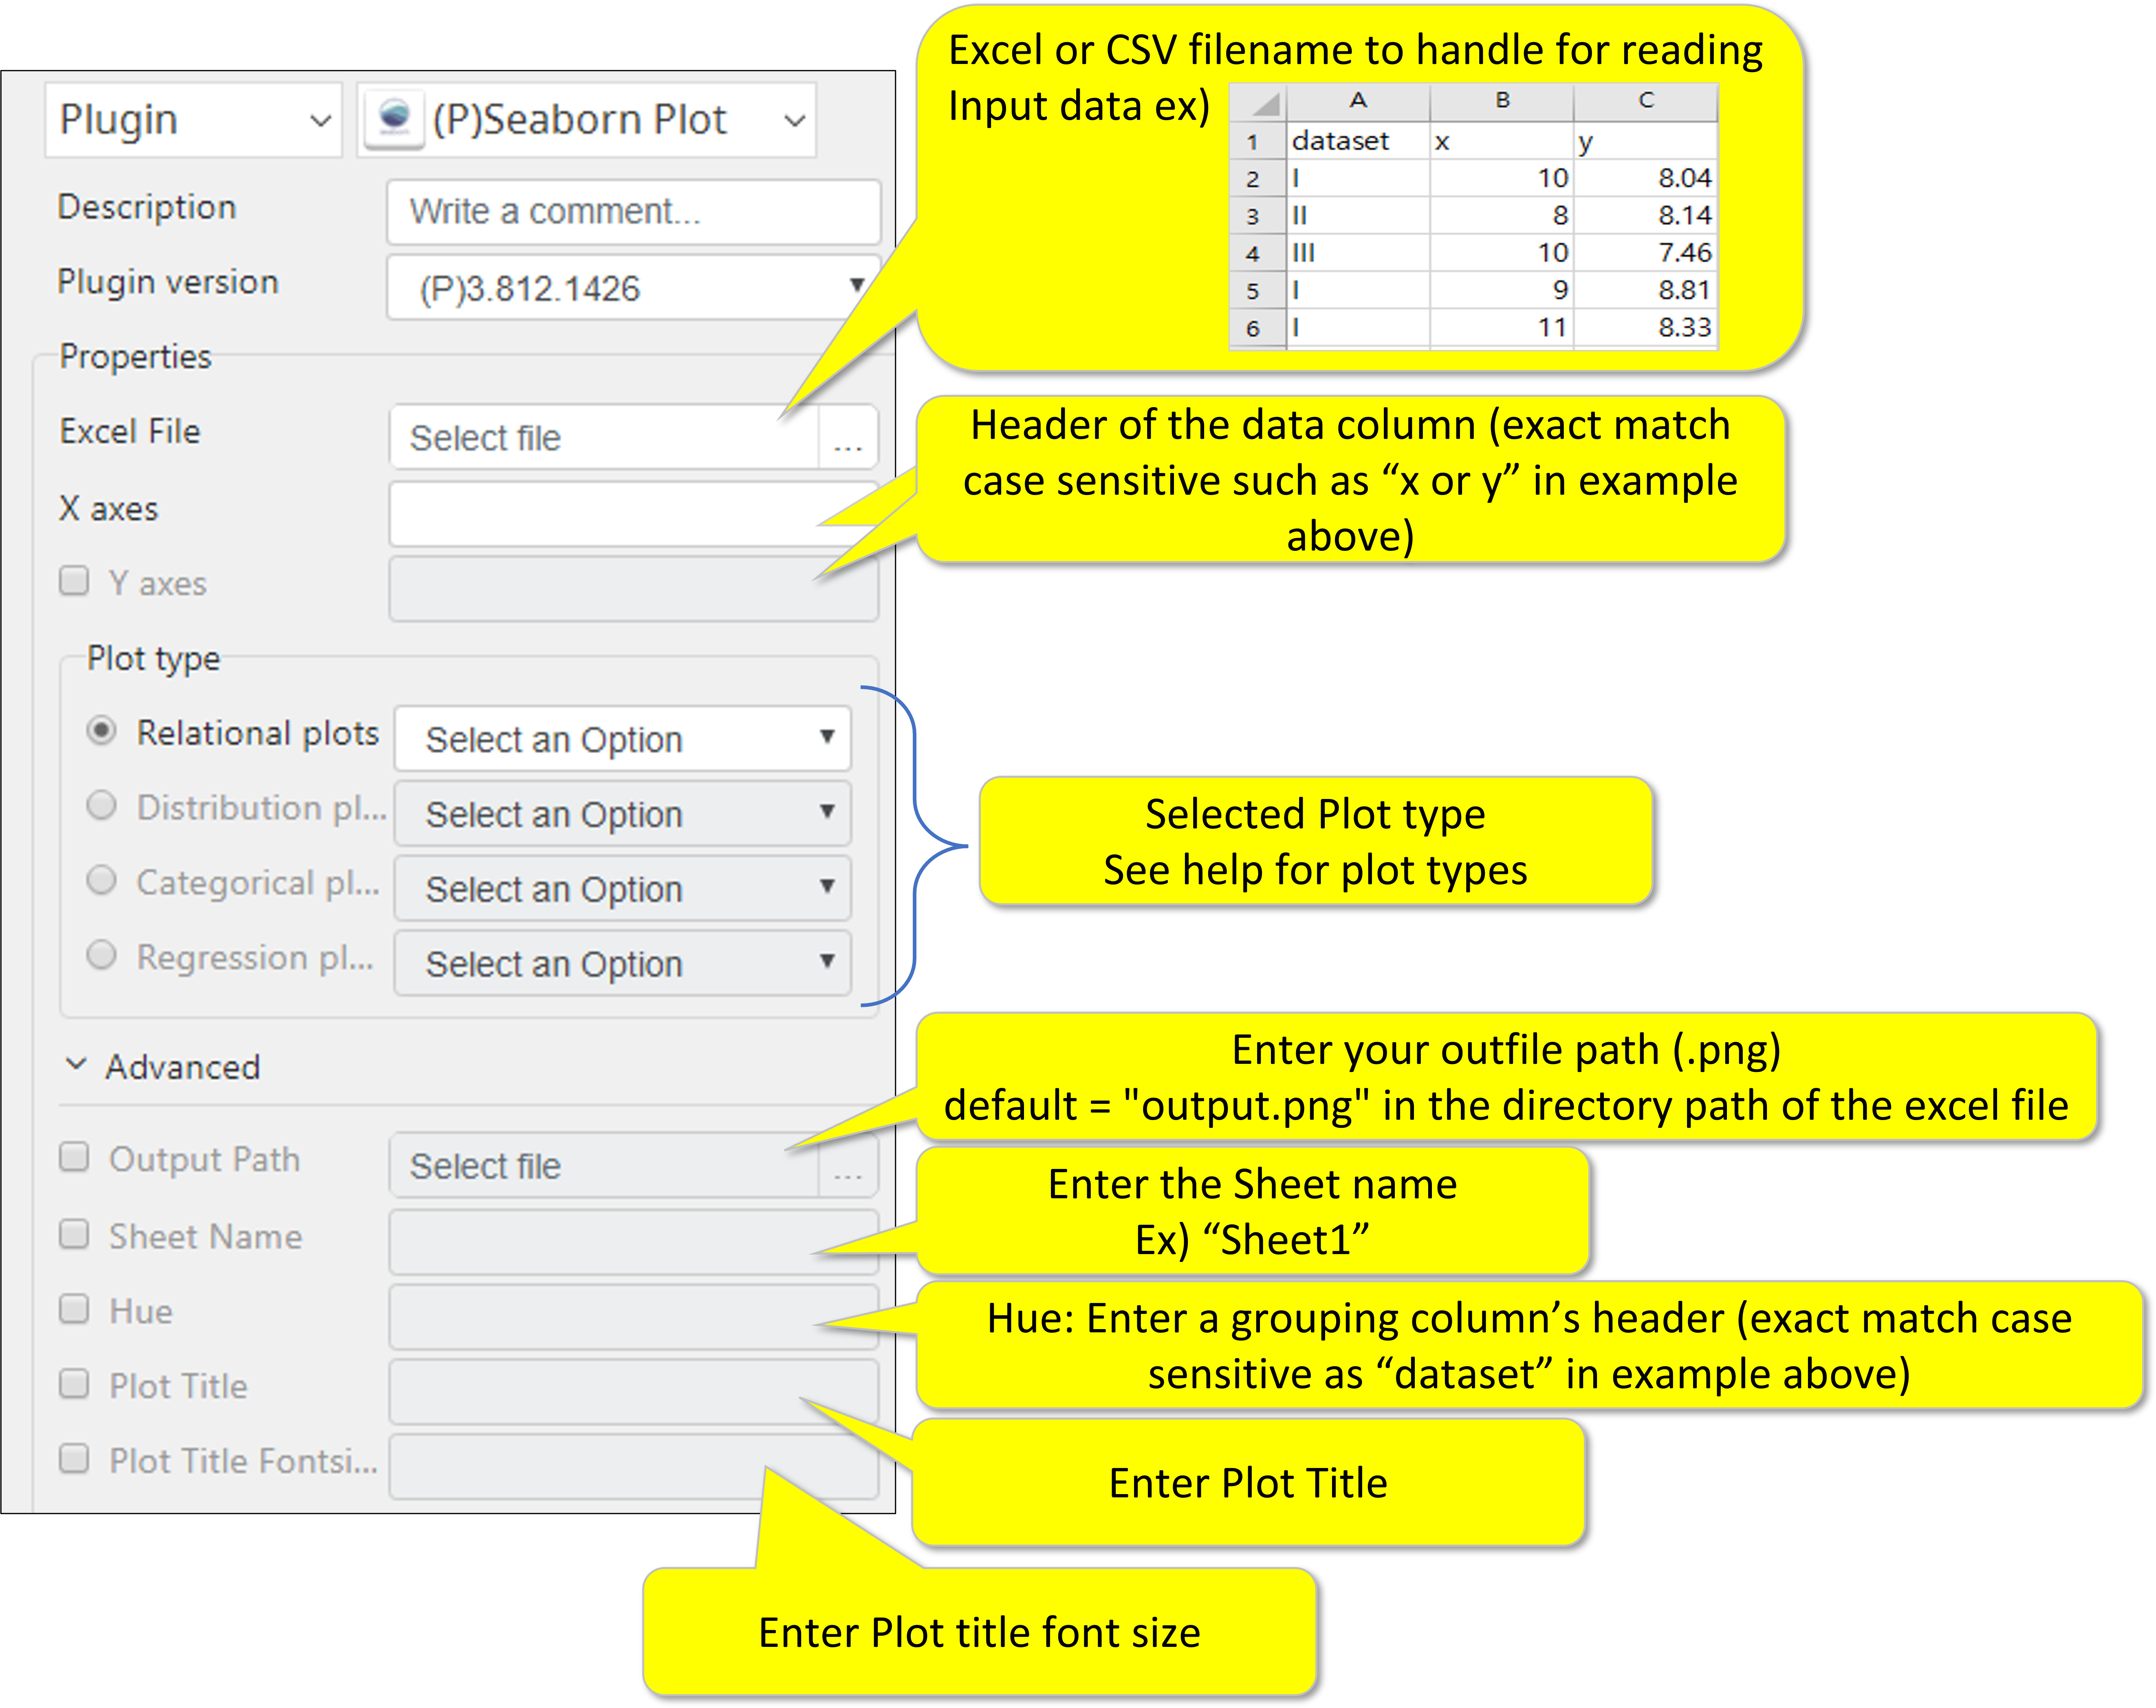
- Input data file (either .xlsx or csv)
- Data header for X and Y axis (header from the first row of the xlsx or csv)
- Please note that the row1 of the xlsx/csv must contain “header” of the data column, meaning the first data starts at row2.
- Plot type
More details here https://seaborn.pydata.org/introduction.html
Optional Input
- Output file path
- Sheet name of the input data
Advanced Parameters
- Hue (color scheme)
- Plot title
- Plot title font size
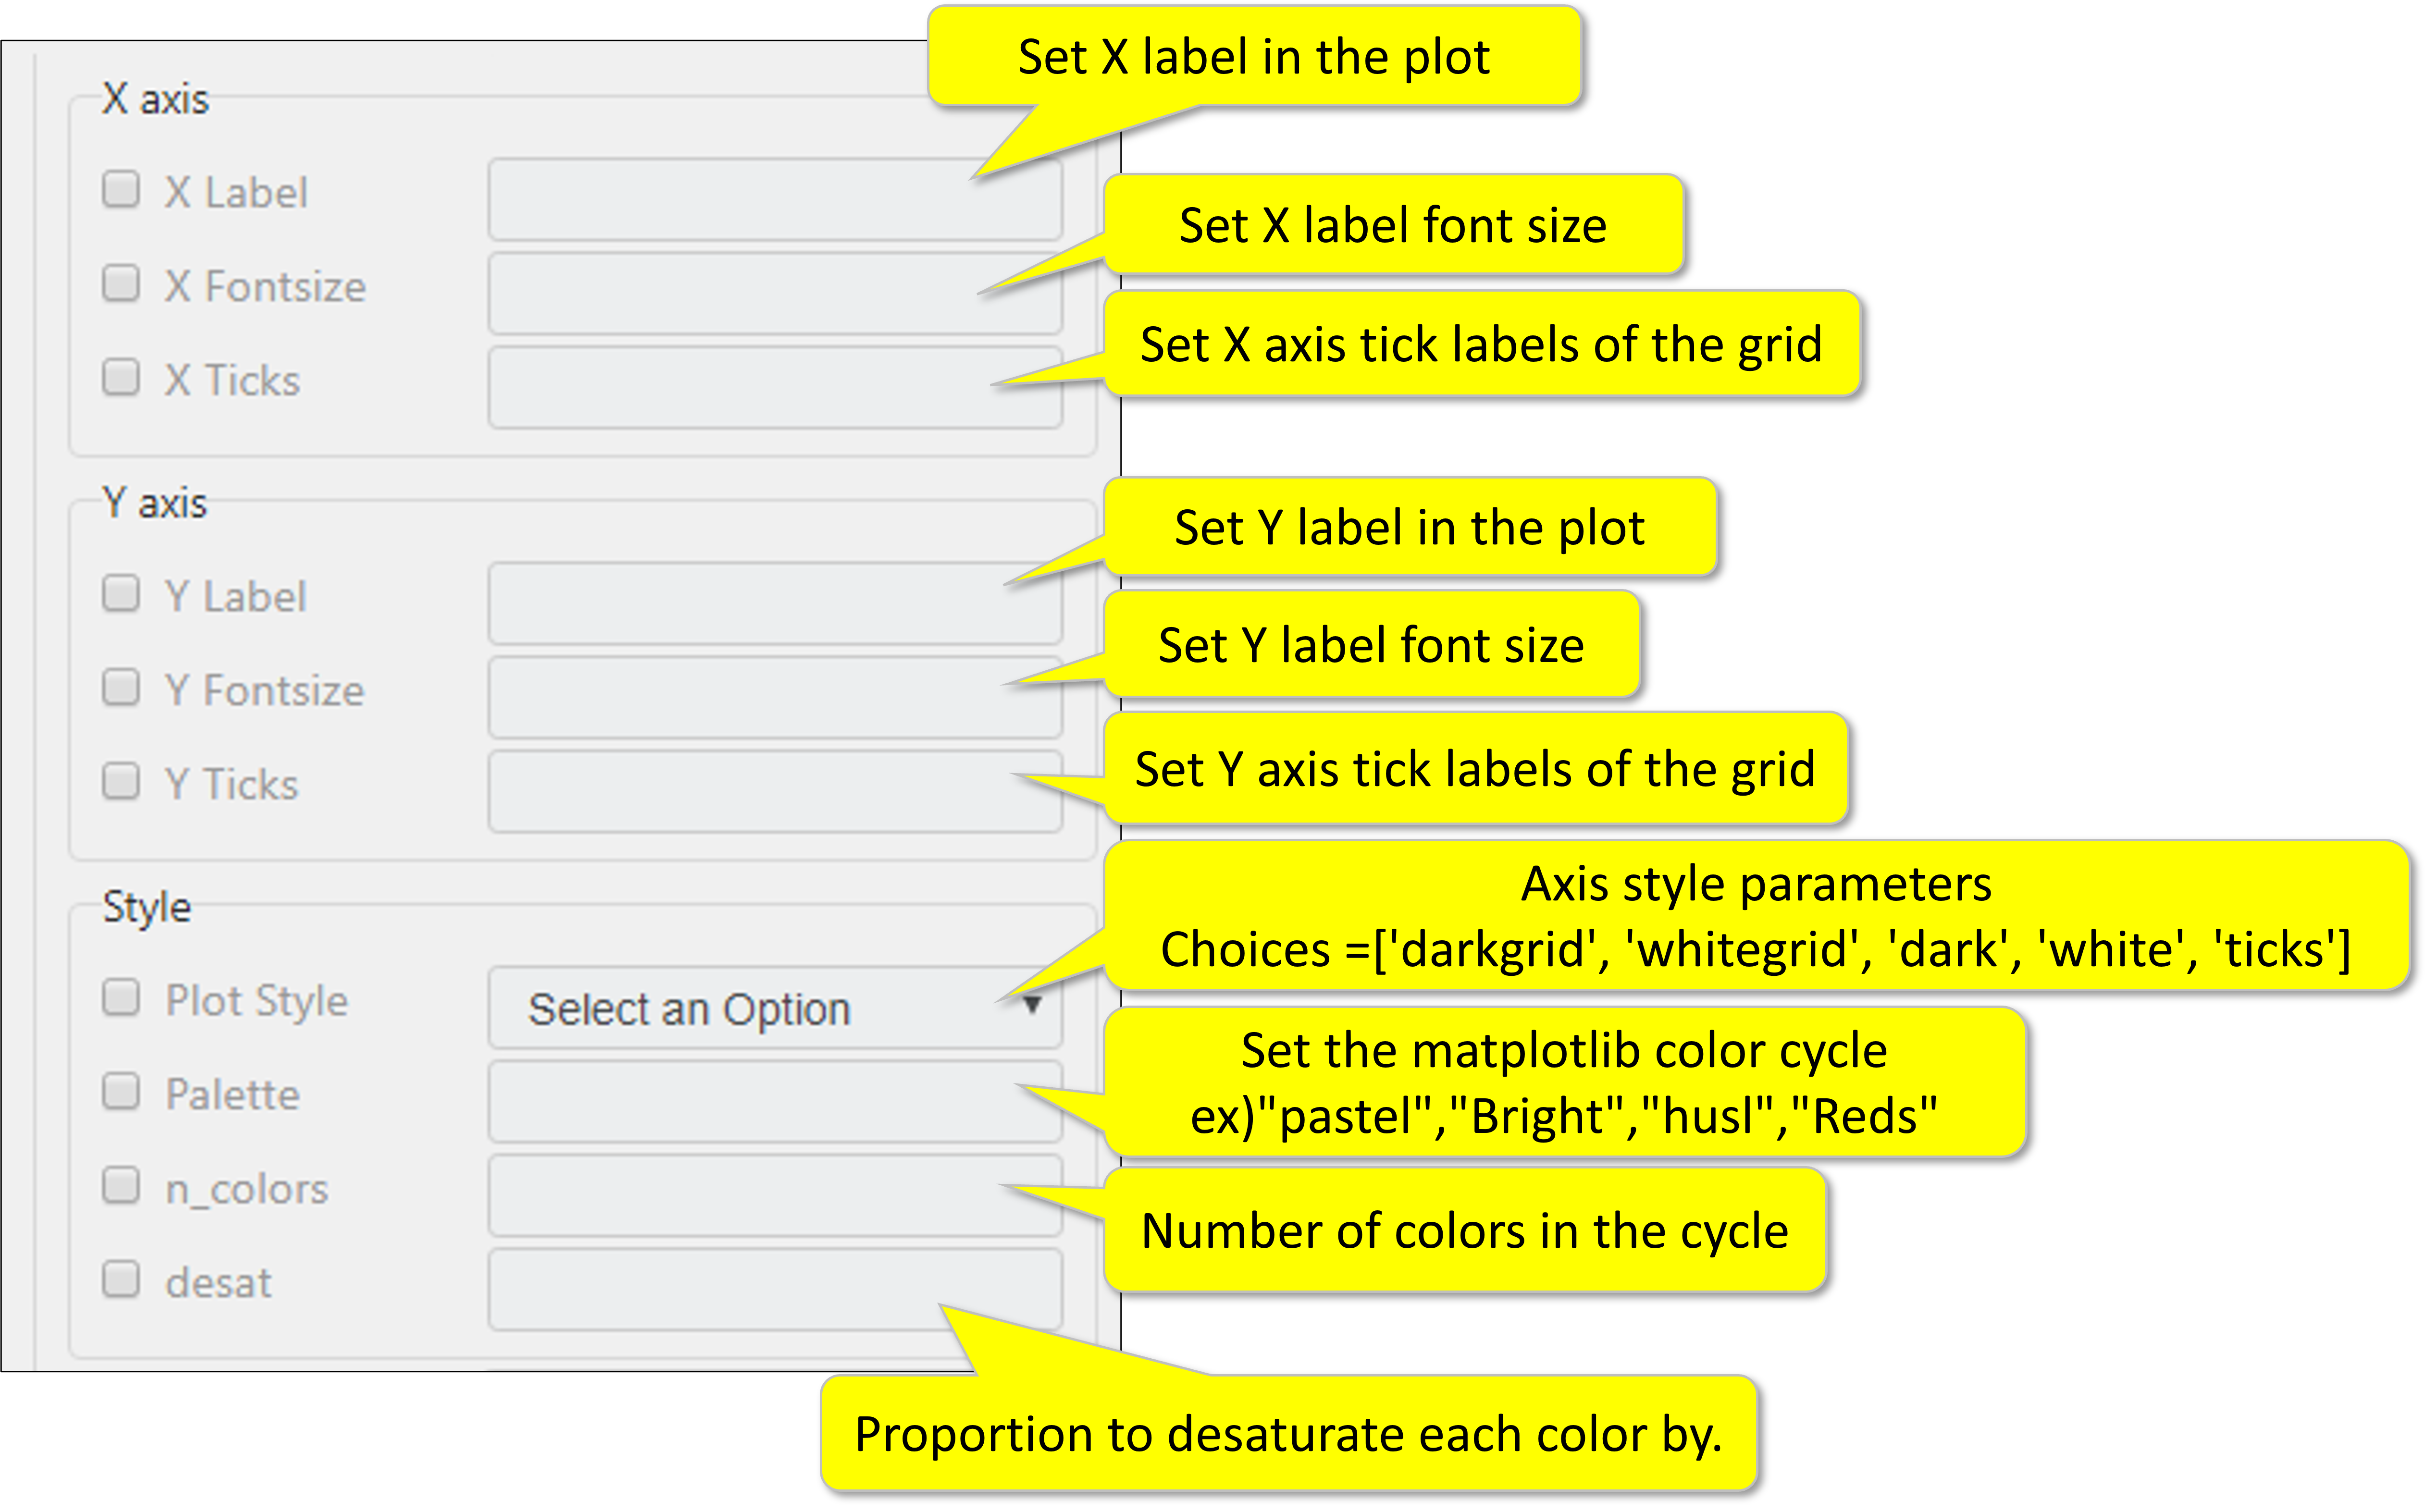
- X axis label, font size, and tick
- Y axis label, font size, and tick
- Plot style (background, grid, color pallet, number of colors, and desaturation rate (proportion)
- Subplot adjustment (margin adjustment)
Return Value
- Output file full path (Sting, CSV, or File)
Return Code
- 0 = successful execution
- 1 = any response from the plugin
Parameter Setting Examples
Please note that the row1 of the xlsx/csv must contain “header” of the data column, meaning the first data starts at row2.
Additional Information about Advanced Parameters
Advanced
Output Path : Enter your outfile path(extension .png ,.jpg)
default = "output.png" in the directory path of the excel file
Sheet Name : When using an Excel file, you can select a sheet name.
Hue : Grouping variable that will produce elements with different colors.
Plot Title : Enter the title of the plot (only English)
Plot Fontsize : Enter title fontsize.
X and Y axis
(X, Y) Lable : Enter X and Y axis label in the plot(only English)
(X, Y) Fontsize : Enter X and Y axis fontsize in the plot
(X, Y) Ticks : Enter X and Y axis tick labels of the grid (min, max, step)
Style
Plot Style: Background style of the plots.
choice = 'darkgrid' 'whitegrid’ 'dark’ 'white’ 'ticks’
Palette : Enter a sequence color or palette.
Ex)
n_colors : Number of colors in the palette. (Type int)
Desat : Proportion to desaturate each color by. (Type float)
Encoding: Encoding for CSV file, default is “utf-8”
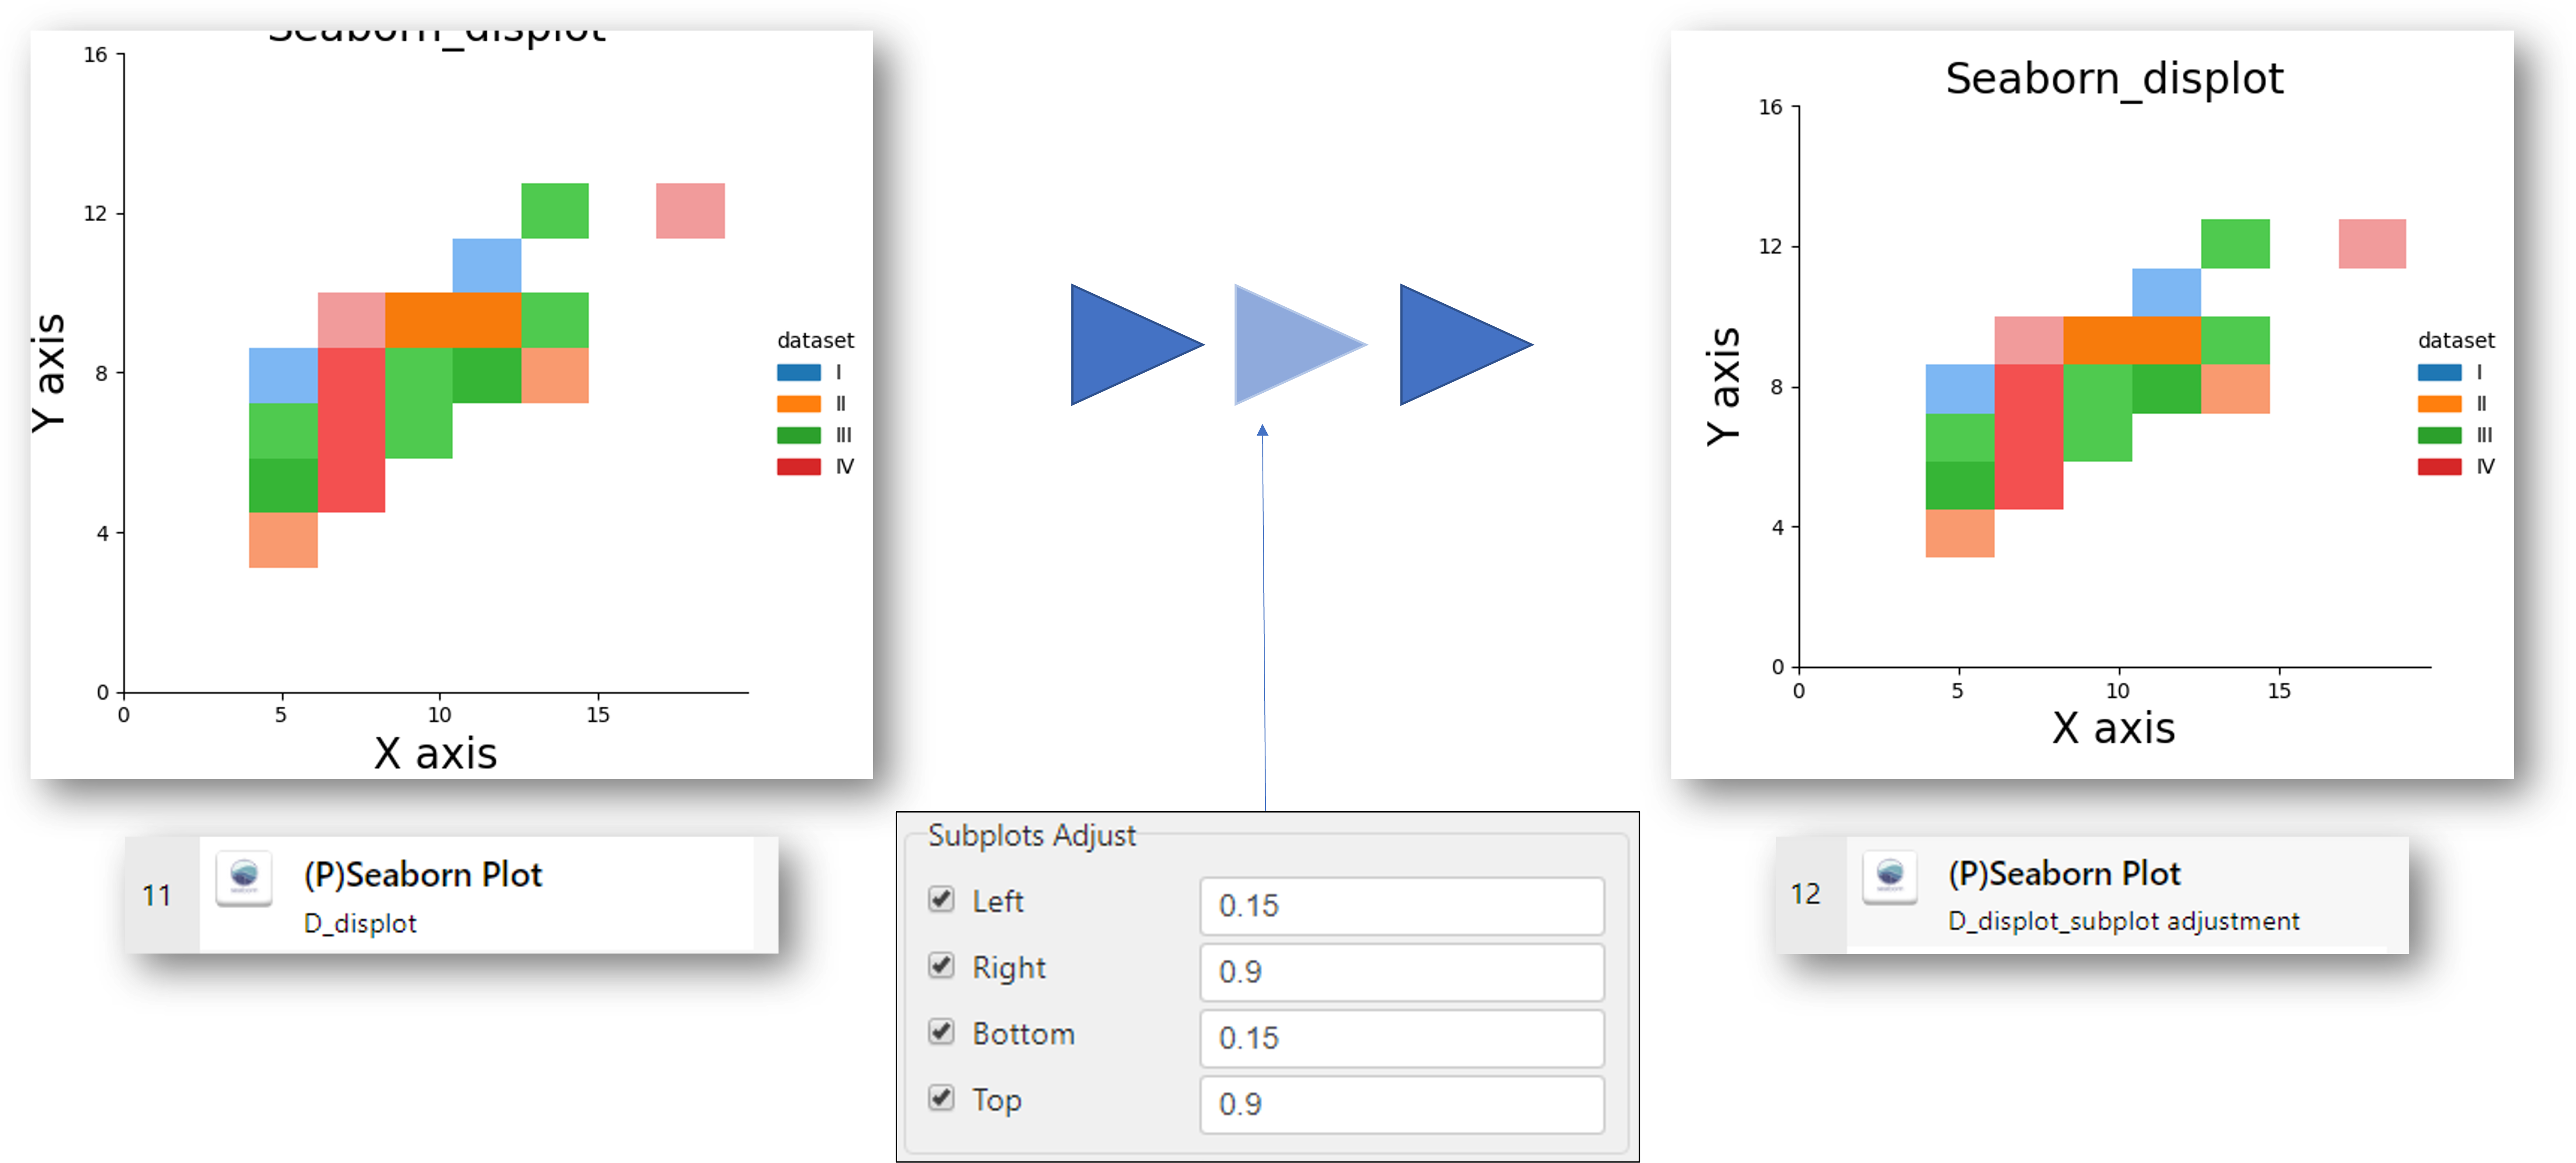
Subplots Adjust
Options to solve when the title of the plot is cut or overlapped
Left: The position of the left edge of the subplots, as a fraction of the figure width.
Right: The position of the right edge of the subplots, as a fraction of the figure width.
Bottom: The position of the bottom edge of the subplots, as a fraction of the figure height.
Top: The position of the top edge of the subplots, as a fraction of the figure height.


