/
Data Plot I-3.416.1000
Data Plot I-3.416.1000
- ARGOSLABS
Owned by ARGOSLABS
Dec 01, 2023
Analytics
Loading data...
| Data Plot I |
|---|---|
Author: Irene Cho Primary Features
|

Required Parameters
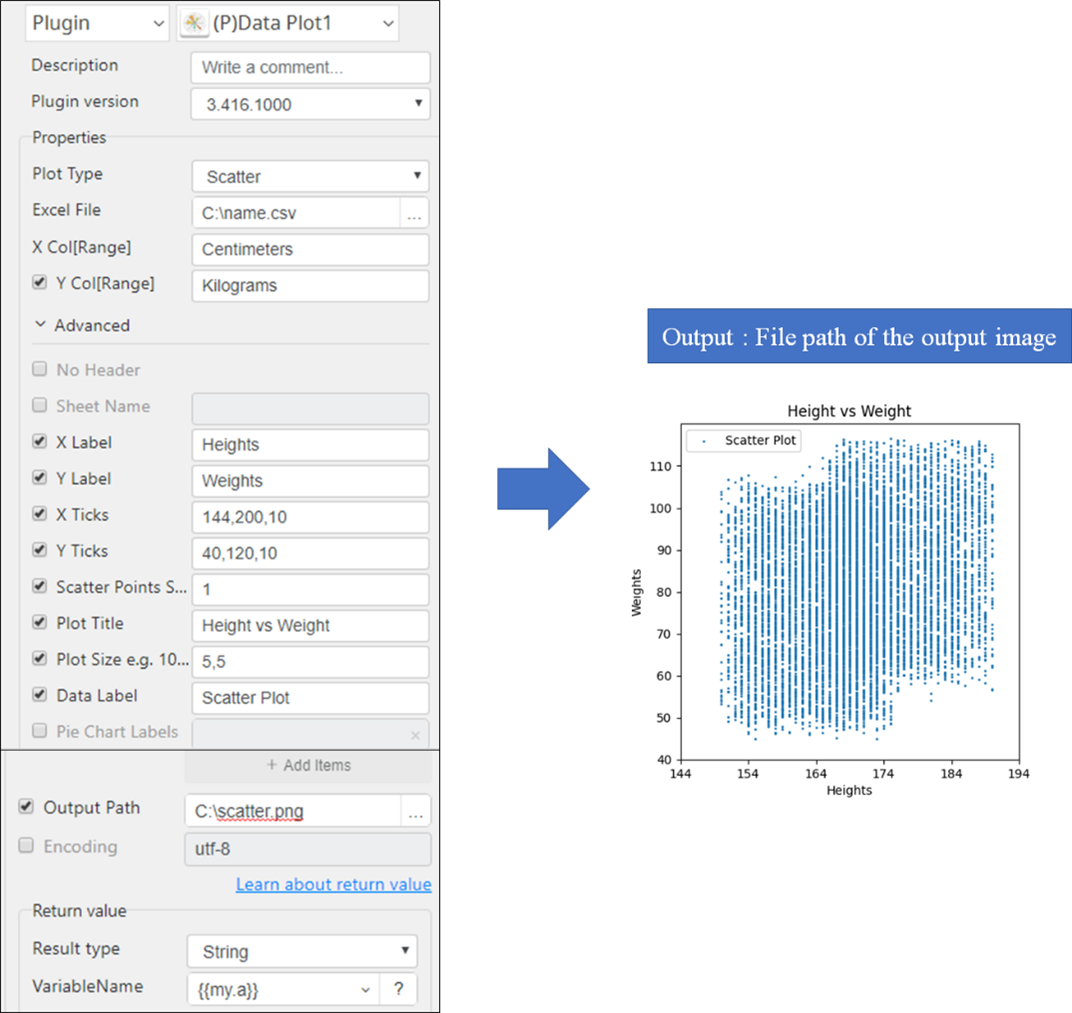
- Plot Type: Scatter, Line, Bar and Pie
- Excel File: Accept an excel file e.g., *.csv, *.tsv, *.xlsx, *.xls, *.xlsm
- X Col[Range]: X column and range (In a pie plot, it is a default column)
e.g. age[1:3] => select the column ‘age’ from row 1 to 3
Advanced Parameters
- Y Col[Range]: Y column and range
- No Header: Specify if there is no header in the dataset (default is header included)
- Sheet Name: Sheet name in an excel file
- X Label: Label for X axis
- Y Label: Label for Y axis
- Scatter Points Size: Size of the data points in a scatter plot
- Plot Title: Title of a plot
- Plot Size: Size of a plot with the format like ‘width, height’ by inches e.g. 5,5
- Data Label: Legend labels
- Pie Chart Labels: Legend labels for a pie chart. The number of labels is dependent on the number of data
- Output Path: An absolute file path for output image. Default is ‘output.png’ which will be saved in the same folder of the given excel file
- Encoding: Encoding of an excel file
| Plot Type | Required Parameters | Output |
|---|---|---|
| Scatter | Y Col[Range] | An absolute file path for the output image |
| Line | Y Col[Range] | |
| Bar | Y Col[Range] | |
| Pie |
Plugin Example
Related content
Data Plot I-3.416.1000
Data Plot I-3.416.1000
More like this
Seaborn Plot-3.1028.1003
Seaborn Plot-3.1028.1003
More like this
PANDAS profiling-2.507.1215
PANDAS profiling-2.507.1215
More like this
PANDAS profiling-2.507.1215
PANDAS profiling-2.507.1215
More like this
Regression-2.605.1100
Regression-2.605.1100
More like this
Regression-2.605.1100
Regression-2.605.1100
More like this