Lazarus Grid
1. Parameter Settings
Basic Settings
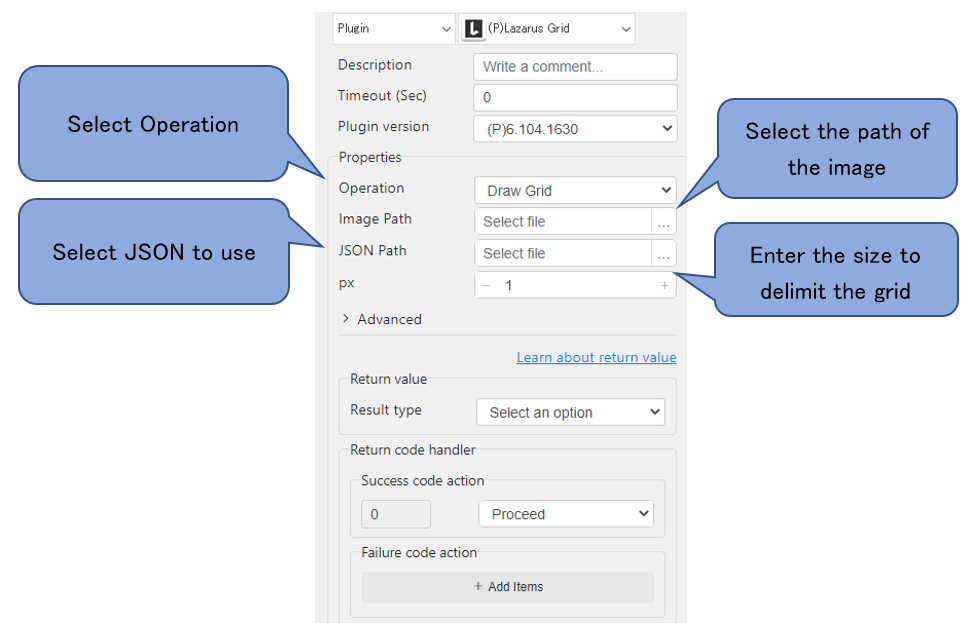
Operation :
Draw Grid : Writes a grid and cell numbers into the image.
- Draw Polygons : Enclose each element with a line.
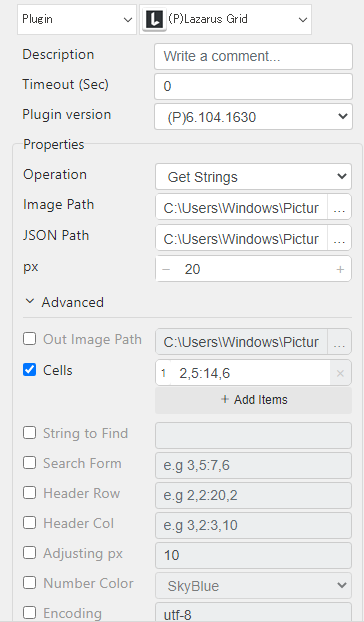
Get String: Specify a cell and get a string.
Get Position: Get the position of a cell by specifying a string.
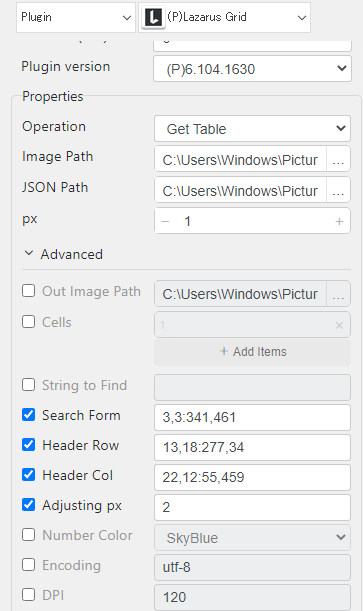
Get Table: Specify a range and a header to get a table.
| Draw Grid | Draw Polygons | Get String | Get Position | Get Table |
|---|---|---|---|---|
| *Image Path | *Image Path | (Image Path) | (Image Path) | *Image Path |
| (JSON Path) | *JSON Path | *JSON Path | *JSON Path | *JSON Path |
| *px | *px | *px | *px | *px |
| *Out Image Path | *Out Image Path | *Cells | *String to Find | *Search From |
| Color | Color | Encoding | Search From | *Header Row |
| Line Thickness | DPI | Encoding | *Header Col | |
| DPI | Page Number | DPI | Adjusting px | |
| CSV Format | Page Number | Encoding | ||
| DPI | ||||
| Page Number |
*Required
Select the image path.
The input format is the format available in Lazarus.
For PDF, please use Print2Image to convert the image and then select the image path. (The resolution "DPI" is required for this.)
JSON Path :
Select the path to the JSON output by Lazarus Forms.
px : select the path to the JSON output by Lazarus Forms.
Specify the grid spacing. Specify in pixel (integer value).
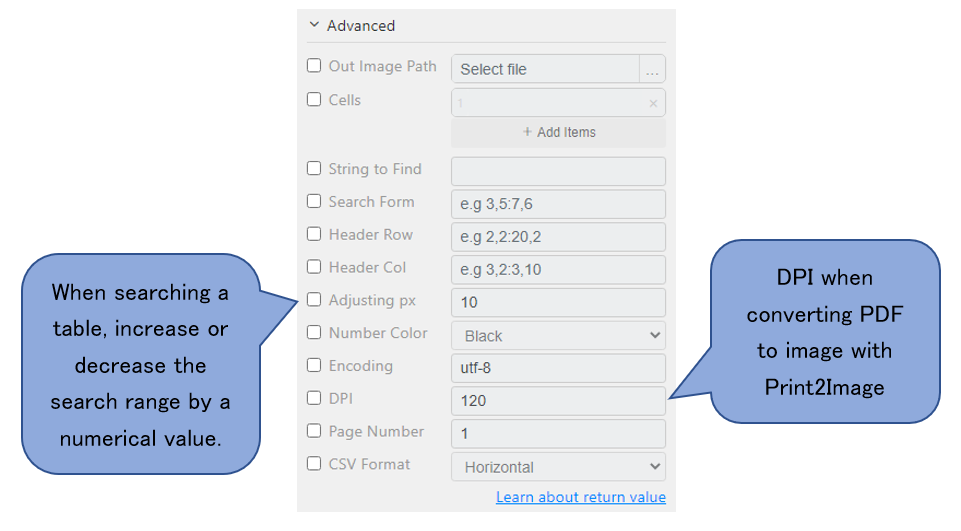
Out Image Path :
Specify the path to output the image with the grid.
The path must be specified as a full path including extensions.
Cells :
Specify cells to get strings.
Cells are specified as follows.
1,3:9,3Specify the starting and ending cells by x,y pairs, respectively.
x is the horizontal direction of the image (rightward) and y is the vertical direction of the image (downward).
String to Find :
Enter a string to find the cell position.
If multiple hits are found, the location of each cell is returned.
Partial matches are also supported.
Search From :
Specify a range when searching cells from a string or retrieving a table.
Specification is done in the same way as specifying cells.
The following are up to version 6.104.1630:Header Row :
Specify the row that will be used as the header when retrieving the table.
Each element within this range becomes a header.
The range should be as narrow as possible. The range should be as narrow as possible, since it will contain other values that you do not want to be headers.
Header Col :
Specify the left-most column to use as a reference for column height when retrieving the table.
Each element that falls within this range is an element of the first column.
In this case, set the range as narrow as possible. The range should be as narrow as possible, since it will contain other values that you do not want to be headers.
Adjusting px :
Adjusting value (px) when retrieving the table.
When acquiring a table, elements are acquired using Header Row and Header Col, and the intersection of each element is acquired as the value of the table. Therefore, depending on the size of the elements, the elements at the intersection may not be retrieved properly.
In such cases, the range of the intersection can be increased (or decreased) by entering a correction value.
The range will be adjusted by the entered value px. A value of + increases the size and a value of - decreases the size.
Version 6.617.1200 and above have the following settings:
When using the following options, the method of retrieving tables has been internally changed.
Previously, elements were retrieved and sorted into a table by specifying each header, but the new version sorts and groups all elements by x,y coordinates and drops them into a CSV format.- Width Correction :
Correction value (px) for width when grouping columns.
Increasing the width allows more elements to be included in the same column. - Height Correlation :
Correction value (px) for height when grouping rows.
Increasing the height allows more elements to be included in the same row. Color :
Changes the color of the cell numbers used when entering the grid into the image.
Some image formats do not allow cell numbering.
- Line Thickness :
Select the line thickness for enclosing the element. Encoding :
Enter the JSON encoding format.
Default is UTF-8.
DPI :
Enter the resolution at which the PDF is converted to an image. Default is set to 120.
This value is also used for JSON processing since PDF is processed by Lazarus Forms and the resulting JSON is output in inches.
Page Number :
Enter the page number if you want to process only specific pages when processing PDFs.
CSV Format : Enter the CSV format in which you want to process the PDF.
When using multiple cells, you can change the orientation of the output results.
The default setting is Horizontal.
Normally, the elements found in each Cell are output horizontally in order. For example
Element A, Element B (←Element in Cell1)
Element C, Element D (←Element in Cell 2)
Element E, Element F, Element G (←Element in Cell 3)
Element H (←Element in Cell4)
If you output the Result Type as CSV in this way, the value of element G will be packed as shown below and cannot be processed as CSV normally.
Element A, Element B, Element G (← Element in Cell1)
Element C, Element D (←Element in Cell2)
Element E, Element F (←Element in Cell 3)
Element H (←Element in Cell4)
Also, since it is difficult to loop through each Cell in this format, there is an output format called **Vertical**. Using this, the output is converted as follows. > Element A, Element C, Element E, Element H
Element B, Element D, Element F
, , Element G
This format allows each cell to be processed vertically, so it can be handled in a loop or the total number of cells can be calculated with COUNT.
Result Type 1.String : String
CSV: CSV
File : String / CSV
3. Example
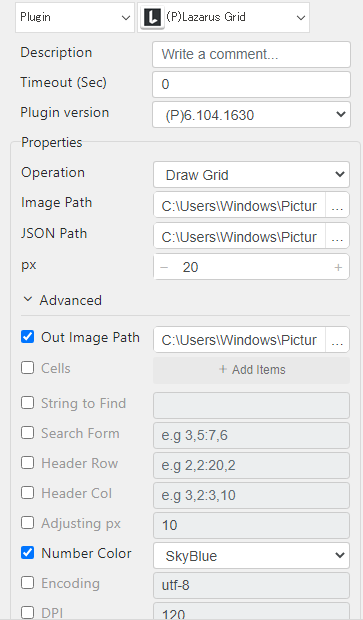
display the grid in the image (number in light blue)
JSON Path:C:\Users\Windows\Pictures\Laz_Category.json
Out Image Path:C:\Users\Windows\Pictures\out_grid.png
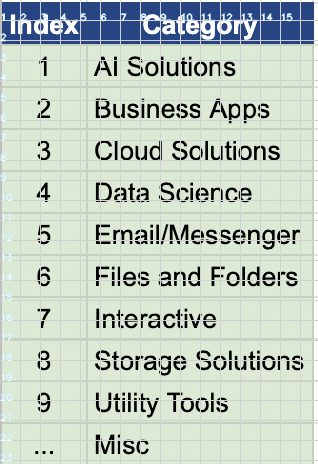
Execution Result:
Return Value:C:\Users\Windows\Pictures\out_grid.png
- 2. specify a Cell to get a string
JSON Path:C:\Users\Windows\Pictures\Laz_Category.json
Execution Result:
2 Business Apps
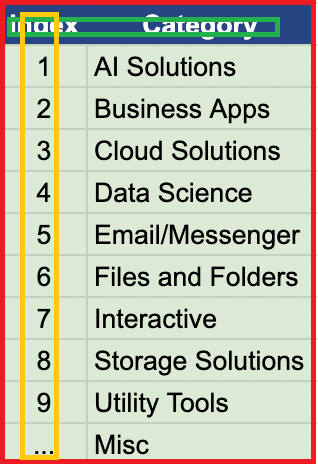
- Import tables as CSV
Header Row: green frame
Header Col: Orange frame
Execution result:
Index,Category
1,Al Solutions
2,Business Apps
3,Cloud Solutions
4,Data Science
5,Email/Messenger
6,Files and Folders
7,Interactive
8,Storage Solutions
9,Utility Tools
... ,Misc
- ABBYY Download
- ABBYY Status
- ABBYY Upload
- AD LDAP
- Adv Send Email
- API Requests
- ARGOS API
- Arithmetic Op
- ASCII Converter
- Attach Image
- AWS S3
- AWS Textra Rekog
- Base64
- Basic Numerical Operations
- Basic String Manipulation
- Bot Collabo
- Box
- Box II
- Chatwork GetMessage
- Chatwork Notification
- Citizen Log
- Clipboard
- Codat API
- Convert CharSet
- Convert Image
- Convert Image II
- Create Newfile
- CSV2XLSX
- Dashboard Api
- DashBord Api
- Data Plot I
- Date OP
- DeepL Free
- Detect CharSet
- Dialog Calendar
- Dialog Error
- Dialog File Selection
- Dialog Forms
- Dialog Info
- Dialog Password
- Dialog Question
- Dialog Text Entry
- Dialog Text Info
- Dialog Warning
- DirectCloud API
- Doc2TXT
- DocDigitizer Get Doc
- DocDigitizer Tracking
- DocDigitizer Upload
- Drag and Drop
- Dropbox
- Dynamic Python
- Email IMAP ReadMon
- Email Read Mon
- Env Check
- Env Var
- Excel2Image
- Excel Advanced
- Excel Advance IV
- Excel AdvII
- Excel AdvIII
- Excel Copy Paste
- Excel Formula
- Excel Large Files
- Excel Macro
- Excel Newfile
- Excel Simple Read
- Excel Simple Write
- Excel Style
- Excel Update
- Fairy Devices mimi AI
- File Conv
- File Downloader
- File Folder Exists
- File Folder Op
- File Status
- Fixed Form Processing
- Floating Form Processing
- Folder Monitor
- Folder Status
- Folder Structure
- FTP Server
- Git HTML Extract
- Google Calendar
- Google Cloud Vision API
- Google Drive
- Google Search API
- Google Sheets
- Google Token
- Google Translate
- Google TTS
- GraphQL API
- Html Extract
- HTML Table
- IBM Speech to Text
- IBM Visual Recognition
- Java UI Automation
- JP Holiday
- JSON Select
- JSON to from CSV
- Lazarus Forms
- Lazarus FTP
- Lazarus Grid
- Lazarus Invoices
- Lazarus RikAI
- Lazarus RikAI2
- Lazarus RikAI2 Async
- Lazarus Riky
- Lazarus VKG
- LINE ID Card OCR
- LINE Notify
- LINE Receipt OCR
- Mangdoc AI Docs
- Microsoft Teams
- MongoDB
- MQTT Publisher
- MS Azure Text Analytics
- MS-SQL
- MS Word Extract
- NAVER OCR
- Newuser-SFDC
- OCI
- OCR PreProcess
- OpenAI API
- Oracle SQL
- Outlook
- Outlook Email
- PANDAS I
- pandas II
- pandas III
- PANDAS profiling
- Parsehub
- Password Generate
- Path Manipulation
- PDF2Doc
- PDF2Table
- PDF2TXT
- PDF Miner
- PDF SplitMerge
- PDF Viewer(Start/Stop)
- PostgreSQL
- Power Query
- PowerShell
- PPTX Template
- Print 2 Image
- Python Selenium
- QR Generate
- QR Read
- RakurakuHanbai API
- Regression
- Rename File
- REST API
- Rossum
- Running GAS
- Scrapy Basic
- Screen Capture
- Screen Recording START
- Screen Recording STOP
- Screen Snipping
- Seaborn Plot
- SharePoint
- Simple Counter
- Simple SFDC
- Slack
- Sort CSV
- Speed Test
- SQL
- SQLite
- SSH Command
- SSH Copy
- String Manipulation
- String Similarity
- Svc Check
- Sys Info
- Telegram
- Tesseract
- Text2PDF
- Text2Word
- Text Read
- Text Write
- Time Diff
- Time Stamp
- Web Extract
- Windows Op
- Windows Screen Lock
- Win UI Control
- Win UI Text
- Word2PDF
- Word2TXT
- Word Editor
- Work Calendar
- XML Extract
- XML Manipulation
- Xtracta Get Doc
- Xtracta Tracking
- Xtracta Upload
- YouTube Operation
- ZipUnzip

